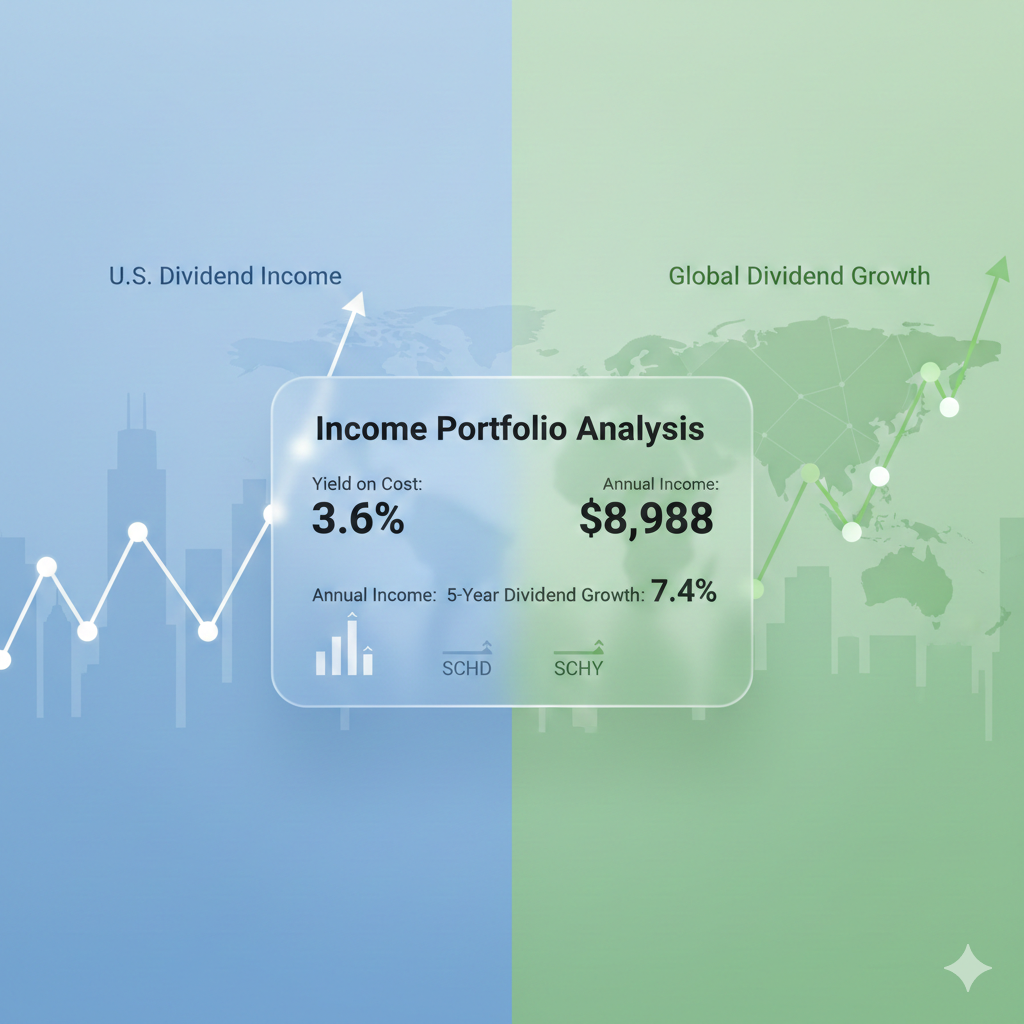
SCHD + SCHY Income Portfolio: 3.6% Yield Today, 5% Potential in 5 Years?
Portfolio Overview
This $250,000 dividend portfolio keeps things simple: two dividend-focused ETFs designed to balance stability, global exposure, and long-term income growth.
Using DividendXray, we can break down not just what the portfolio earns today — but what actually drives that income, how consistent it has been, and what the long-term trajectory might look like.
Dividend Growth Trend
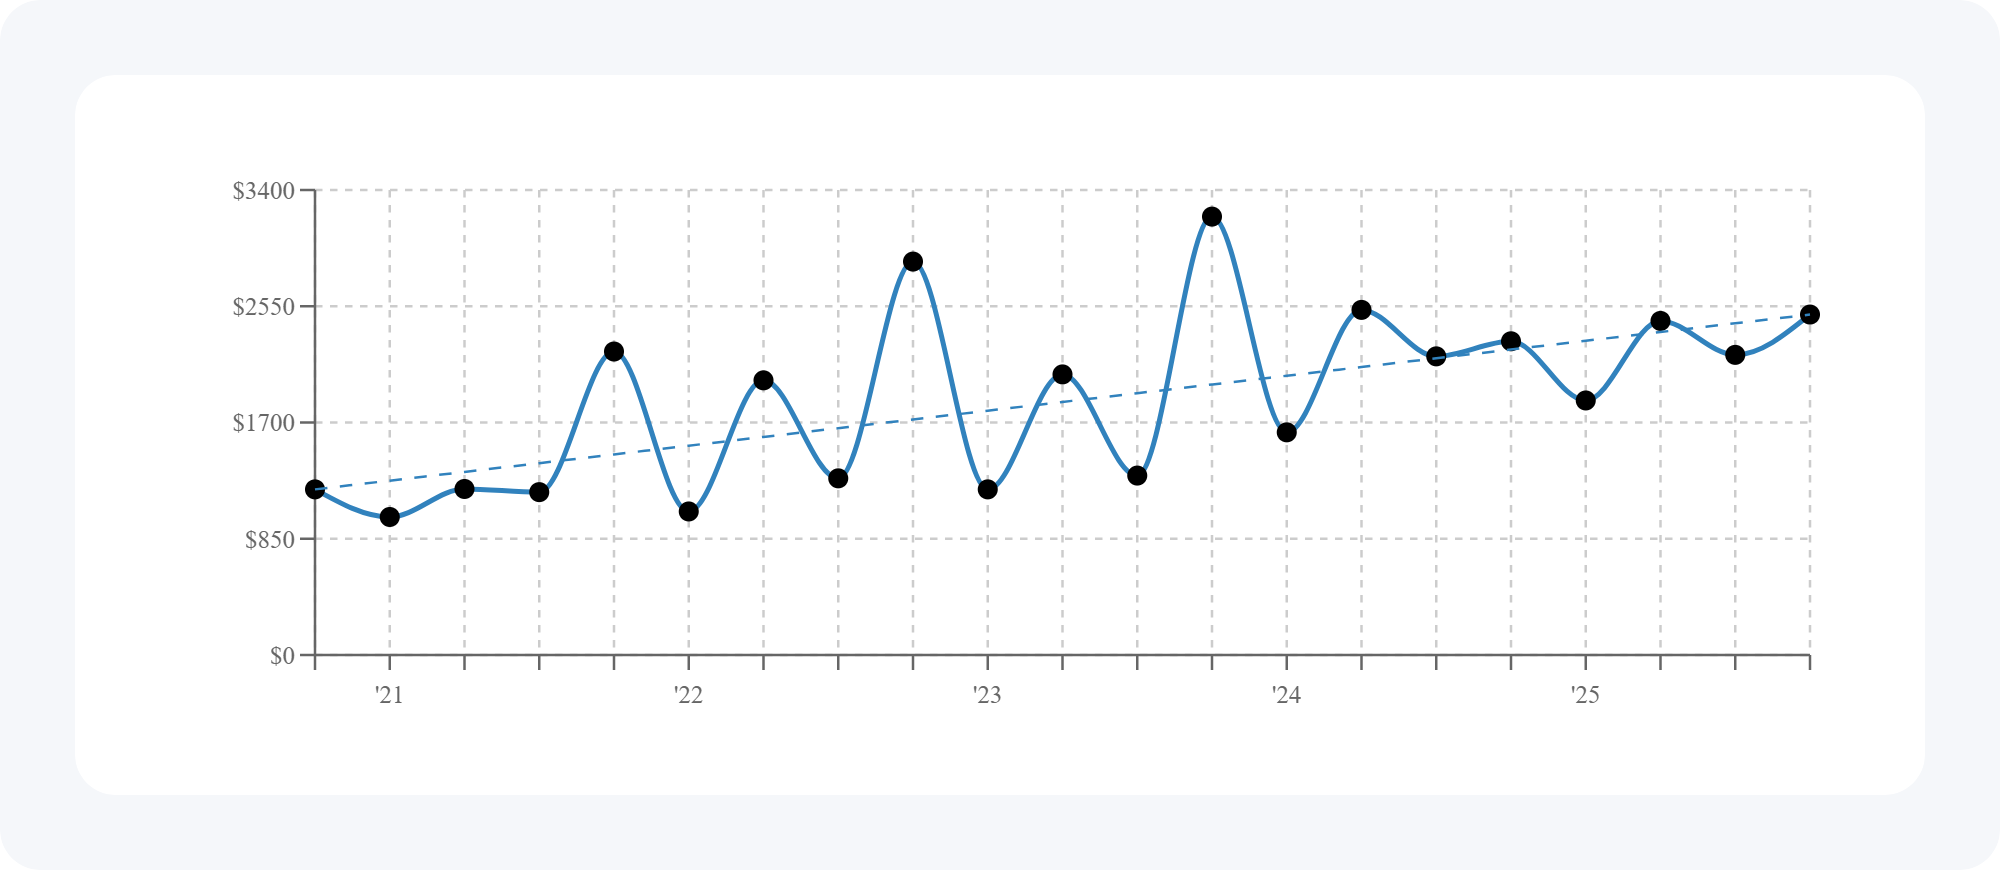
Over the past several years, dividend income has followed a generally upward path, supported by steady growth from established U.S. holdings and supplemental income from international exposure.
It’s important to understand that ex-U.S. and global ETFs can produce lumpier payout schedules. Currency fluctuations and varying dividend calendars may cause income swings that look more volatile than U.S.-only portfolios. That volatility, however, doesn’t necessarily indicate instability — it often reflects structural timing differences in international distributions.
Despite those variations, the broader trend remains constructive, with dividend income compounding at approximately 7.4% annually over this period.
Portfolio Snapshot
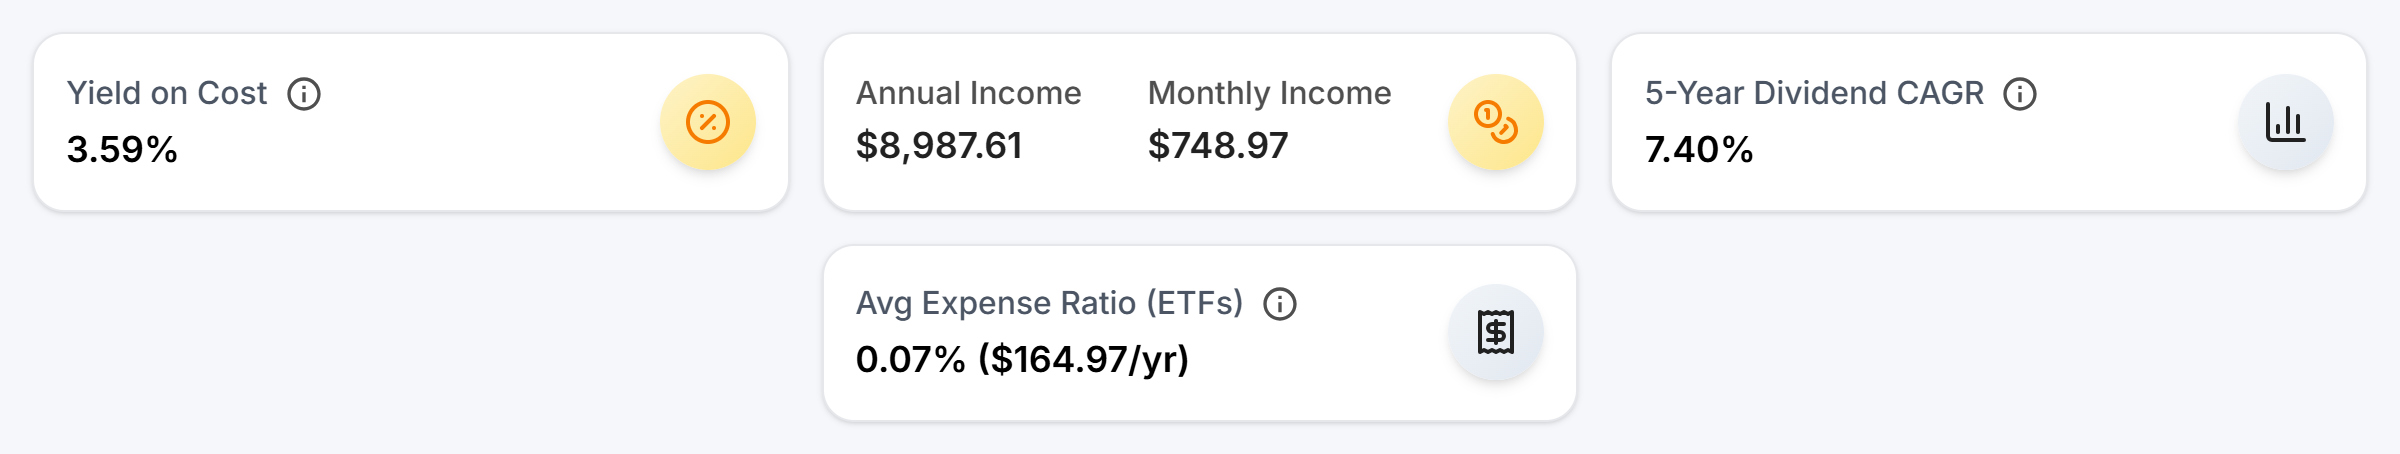
Today, this portfolio generates meaningful cash flow relative to its cost basis.
Yield on cost: 3.6%
Annual income: approximately $8,988
Monthly income: roughly $749
5-year dividend income growth: ~7.4% per year
Average ETF expense ratio: 0.07% (about $165 annually in total fees)
The low blended expense ratio keeps friction minimal, allowing more of the underlying dividend growth to flow directly to investors.
Income Breakdown by Holding
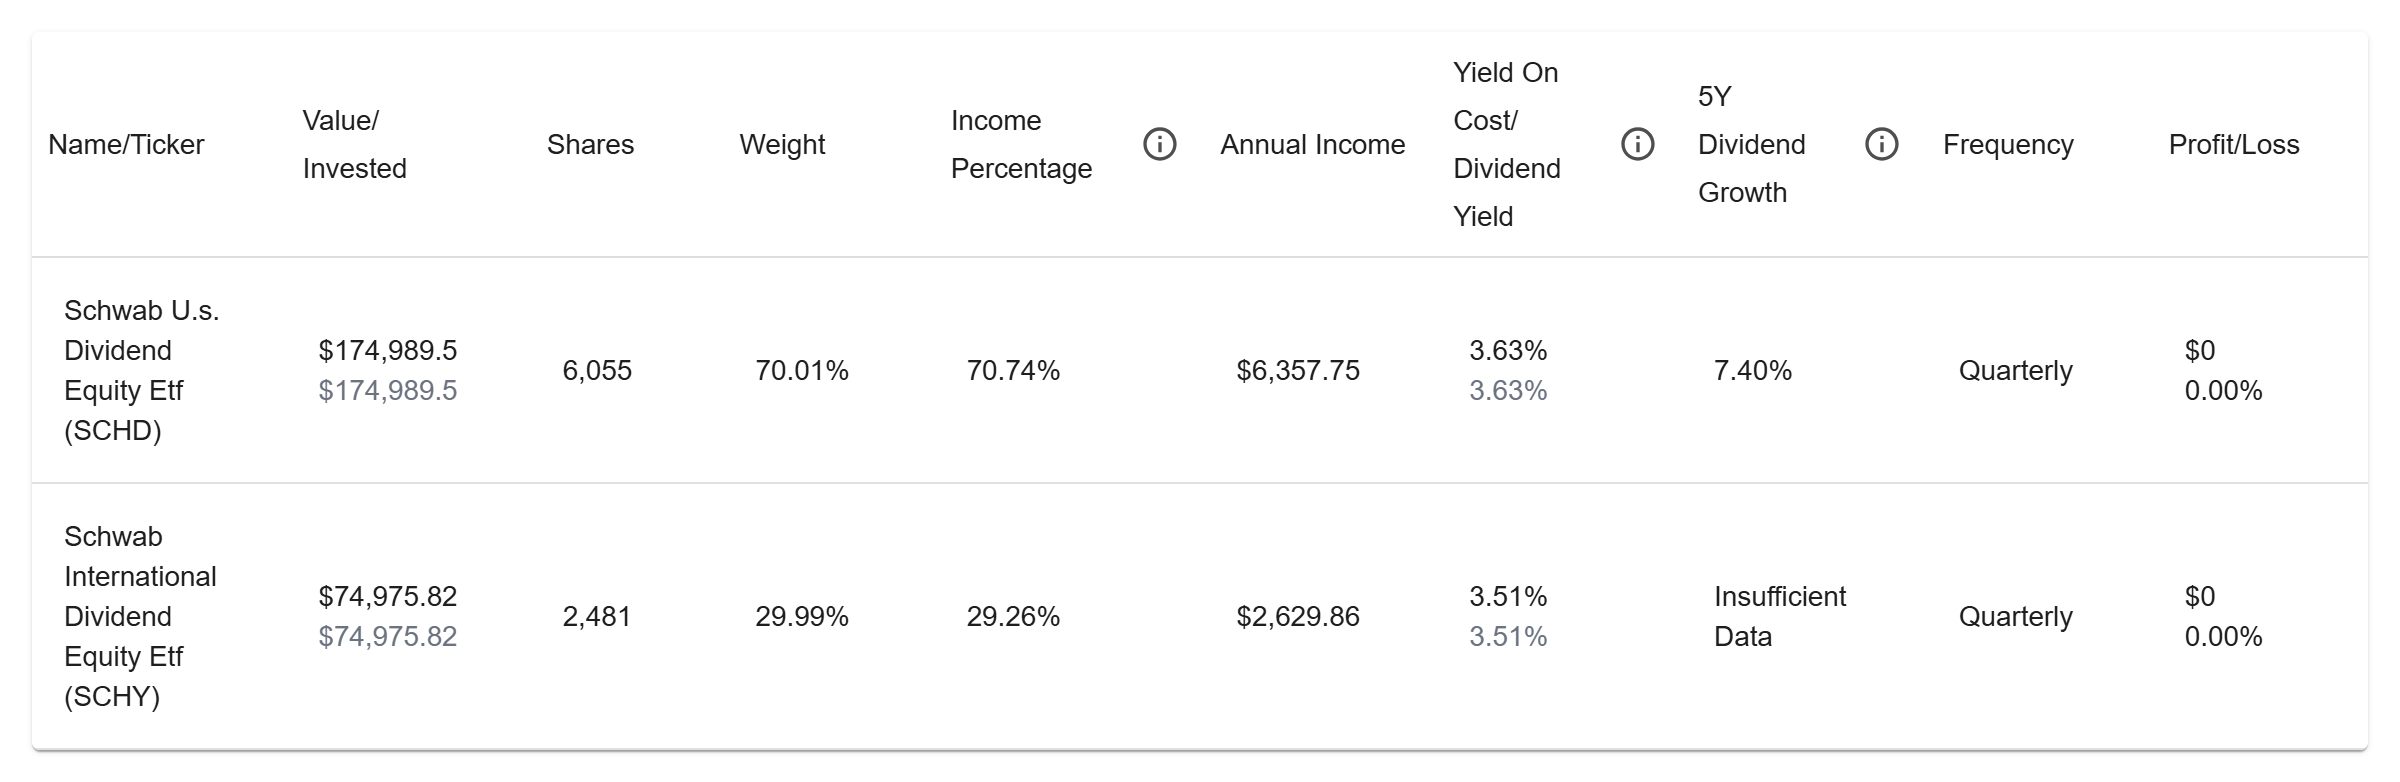
Dividend income is split between two core ETFs:
- SCHD: 70.7% of total income (~$6,358 per year)
- SCHY: 29.3% of total income (~$2,630 per year)
Both ETFs pay quarterly distributions.
SCHD brings an established long-term dividend growth rate near 7.4%, backed by U.S. large-cap dividend payers. SCHY, with a shorter operating history, is still building its long-term growth profile, but provides geographic diversification that may help broaden income sources over time.
Forward Income Outlook
If dividend growth from the established holdings continues at a similar pace, the long-term compounding effect becomes more noticeable.
- Yield on cost could rise from 3.6% today to approximately 5% within five years.
- Annual income could increase from roughly $9,000 to around $12,800 — without adding new capital.
Of course, dividend growth is never guaranteed. Economic cycles, earnings shifts, and currency movements can influence results. But when consistent dividend growth meets low costs and disciplined allocation, the income trajectory becomes clearer — and potentially more powerful over time.