LOW vs KO vs SCHD vs NOBL: 5-Year Dividend Growth & Yield-on-Cost Battle
Portfolio Overview
In this DividendXray battle, we compare four prominent dividend holdings across income growth, yield-on-cost expansion, and total return performance over a five-year period.
- LOW represents a dividend growth powerhouse, combining strong income expansion with significant capital appreciation.
- KO provides defensive stability and reliable income backed by one of the world’s most recognized consumer staple brands.
- SCHD offers diversified dividend exposure, emphasizing quality companies with efficient income growth.
- NOBL focuses on dividend aristocrats — companies with long histories of consistently increasing shareholder income.
Each holding brings a different strength to a dividend-focused portfolio, balancing income stability, growth potential, and capital appreciation.
Category Winners
Looking at the data across dividend CAGR, yield-on-cost growth, and price return, clear category leaders emerge.
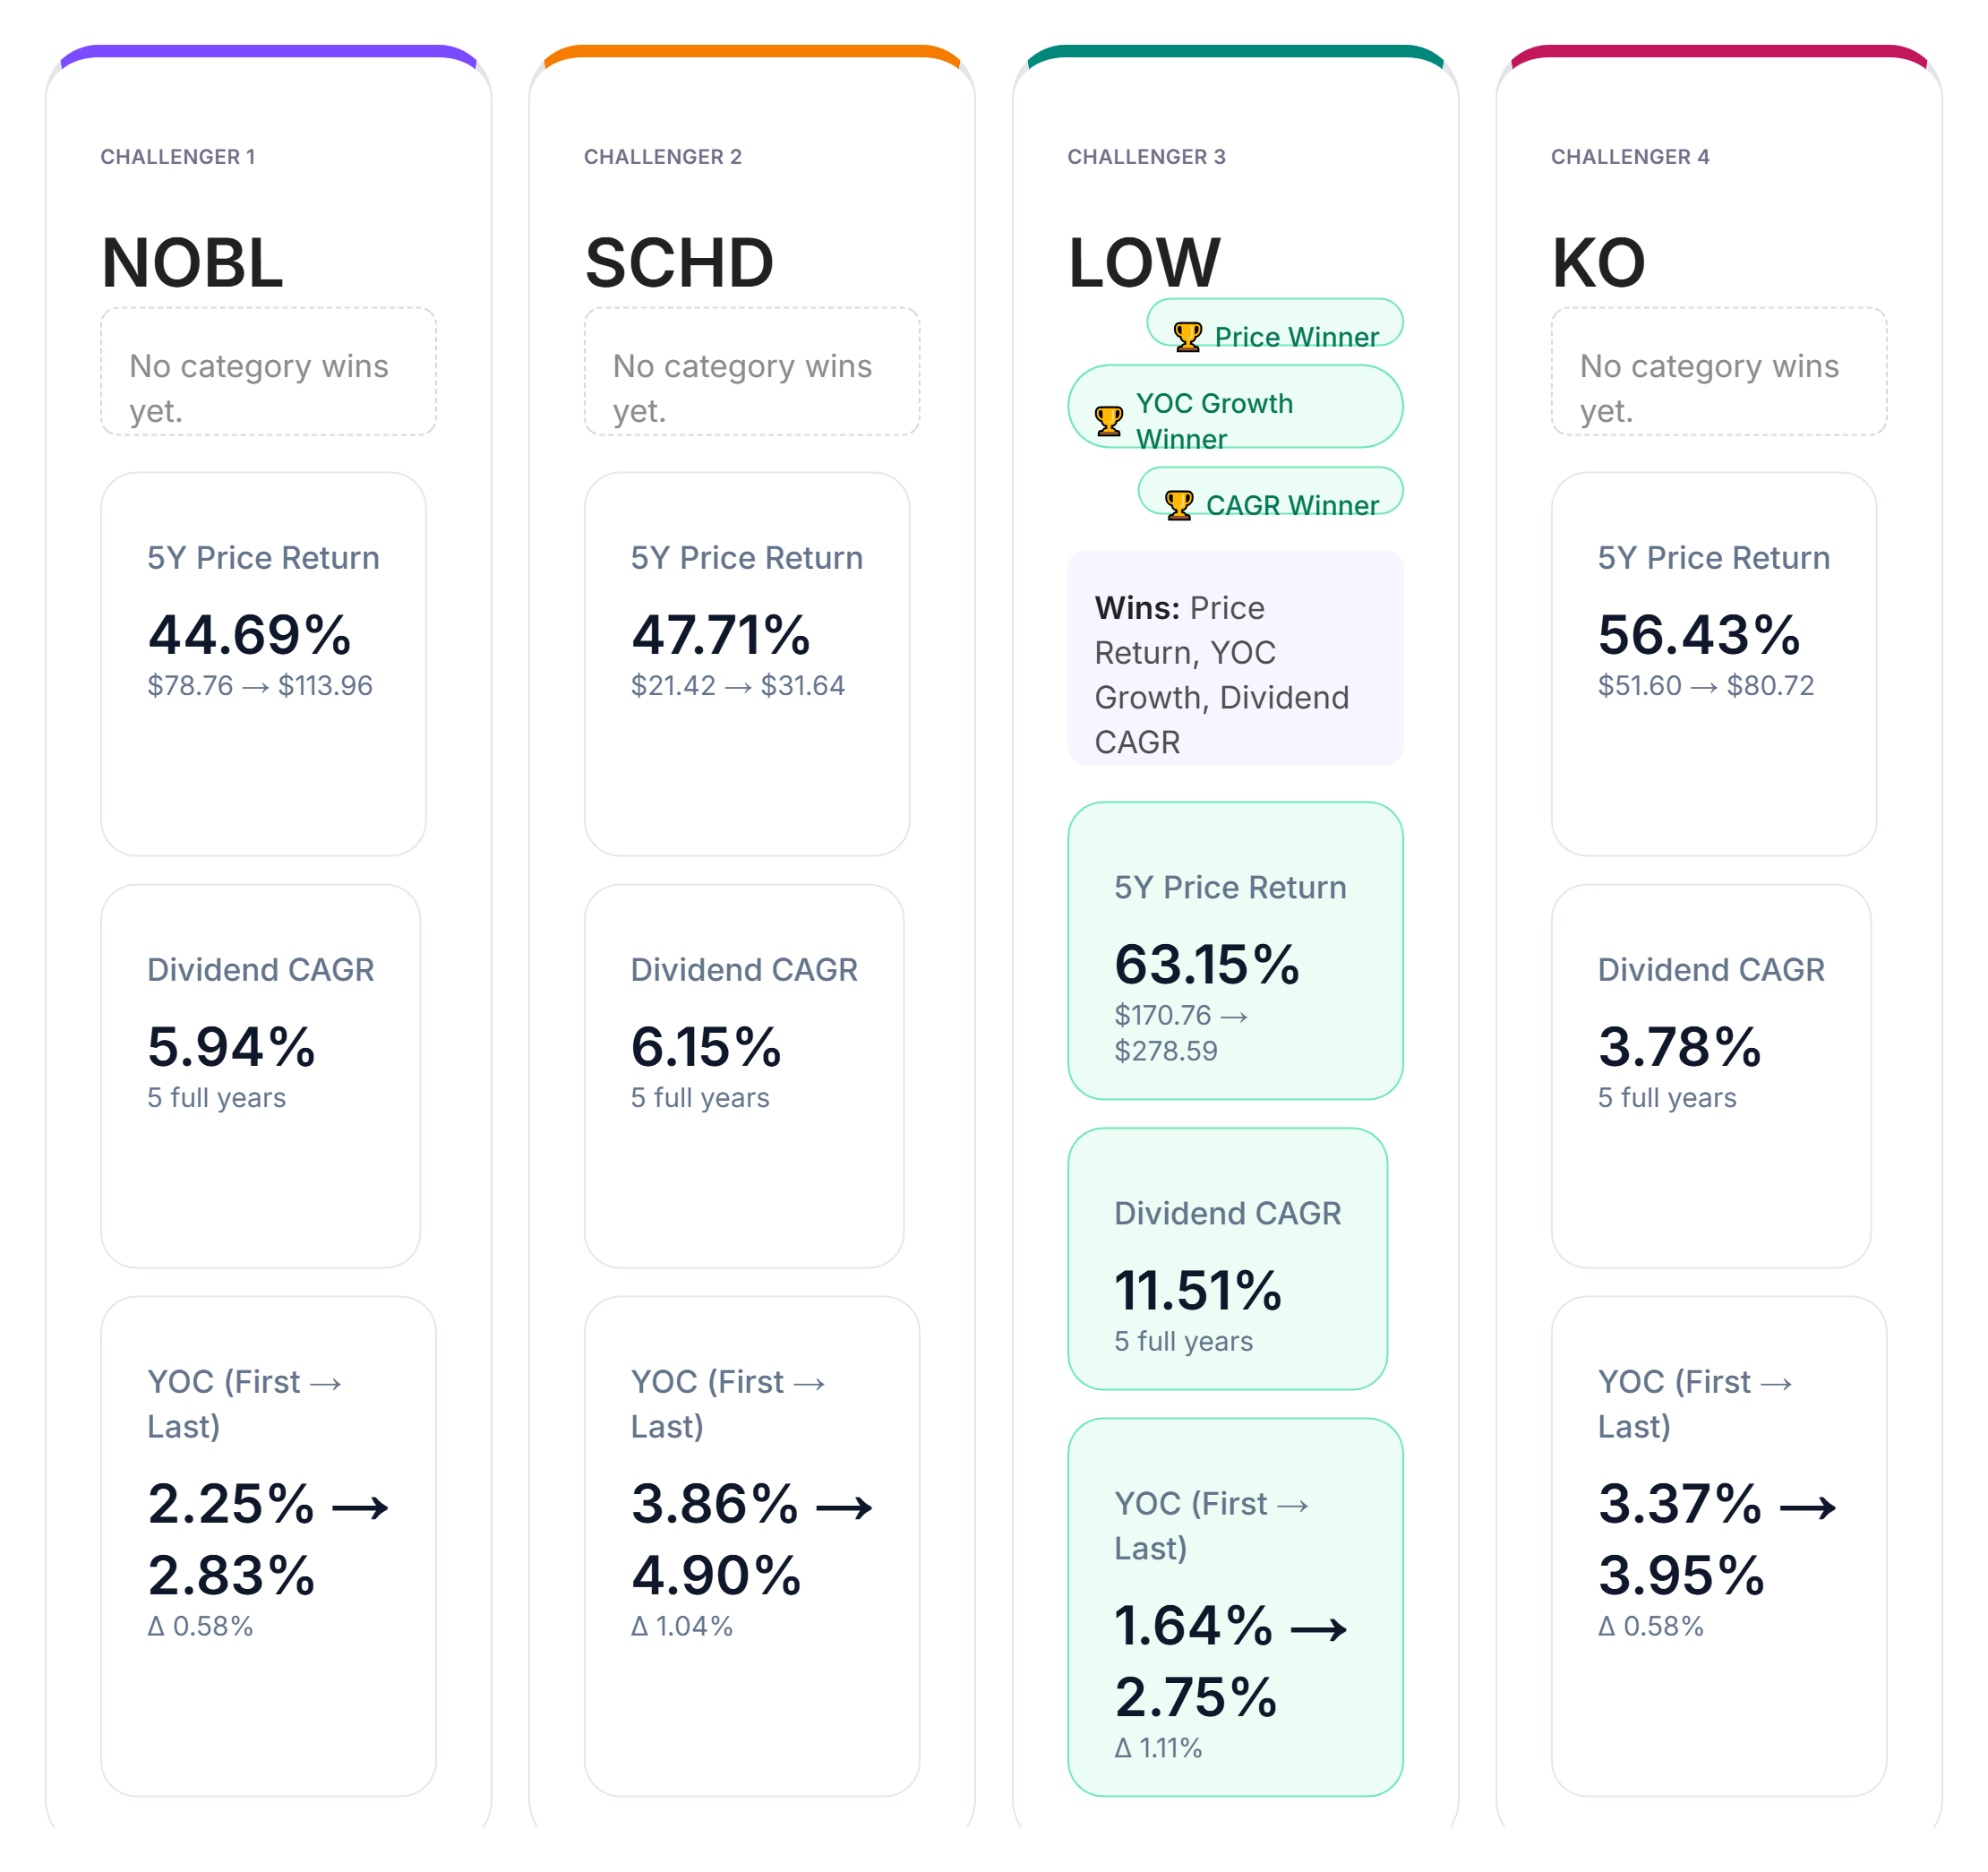
In dividend growth, LOW leads the group with a five-year dividend CAGR of 11.51%.
For yield-on-cost growth, LOW again shows the strongest improvement from first to last year, reflecting powerful income compounding relative to the original investment.
In price return, LOW takes the lead with a five-year return of 63.15%, outperforming the other challengers in total appreciation.
The remaining holdings deliver solid performance across categories, but do not secure a category win in this comparison. The results highlight how strong individual dividend growers can outperform diversified income strategies in certain periods.
Yield-on-Cost by Year
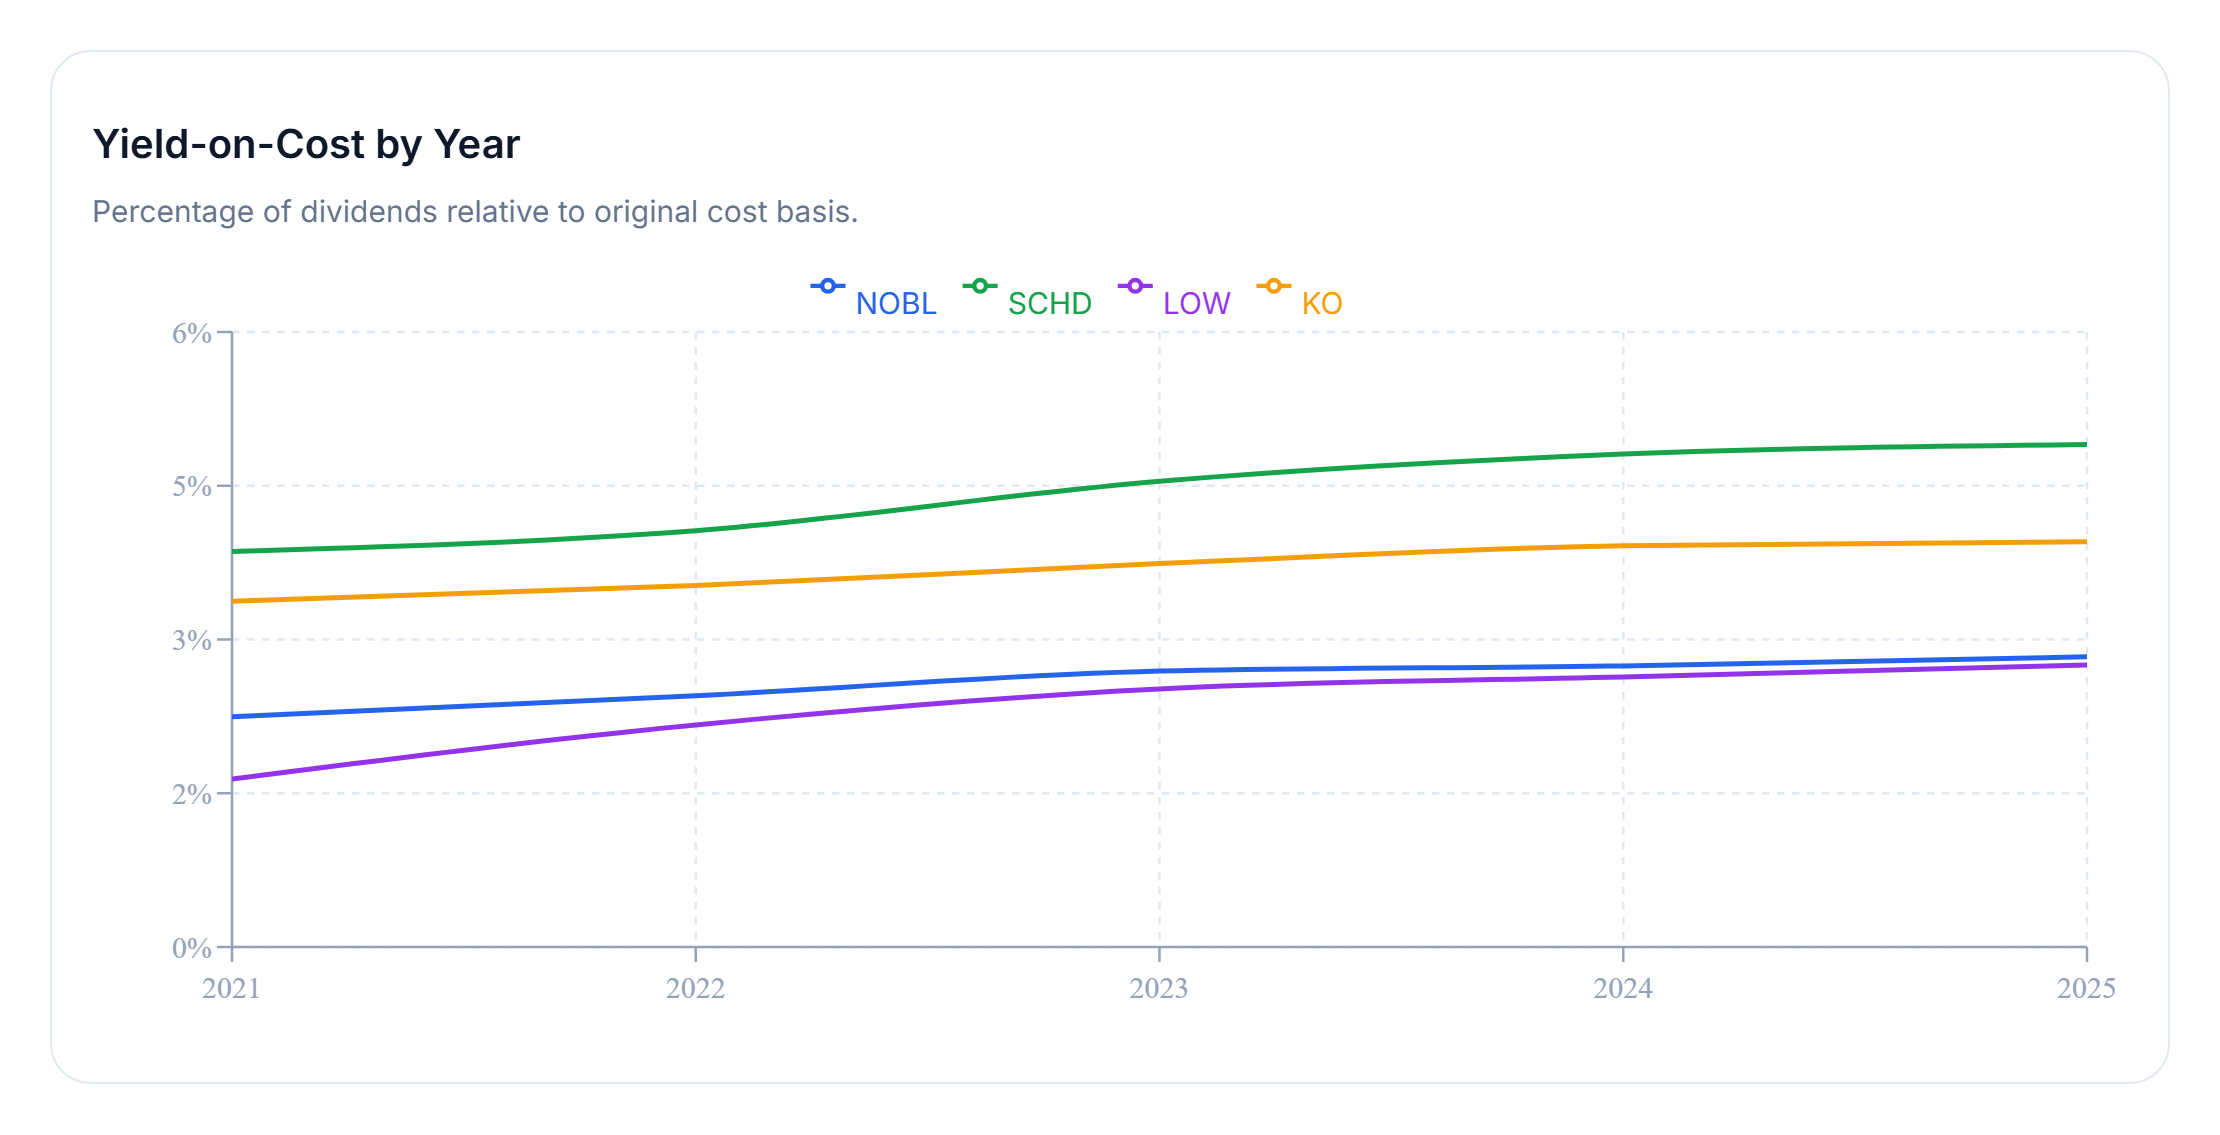
Yield-on-cost measures dividend income relative to the original capital invested. Unlike current yield, it shows how efficiently a holding grows income over time.
Over the five-year window, SCHD stands out with the strongest income efficiency, reaching approximately 4.90% yield on cost by the end of the period.
LOW, KO, and NOBL all demonstrate steady upward income trends as well, reflecting consistent dividend growth across the period. While their growth trajectories are more gradual, compounding effects become more visible over longer time horizons.
For long-term income investors, these distinctions matter. Strong dividend growth combined with disciplined allocation can meaningfully increase income generation — even without adding new capital.
Final Takeaway
There is no single "perfect" dividend holding. Each security reflects a different balance between dividend growth, income stability, and capital appreciation.
This battle shows that LOW currently dominates in dividend growth, yield-on-cost expansion, and price return, highlighting its strength as a dividend growth leader.
Meanwhile, SCHD demonstrates exceptional income efficiency through diversification, while KO and NOBL provide stability and long-term dividend reliability.
Ultimately, the best choice depends on whether your primary goal is maximizing dividend growth, maintaining reliable income, or building a balanced portfolio designed for long-term income compounding.